Token Analytics and Details
The Token Analytics and Details page provides an in-depth overview of each token listed on AuriSwap. This page is designed for users who want to dive deeper into specific token metrics, historical data, and transaction activity. Whether you are analyzing market trends, checking liquidity, or reviewing transaction history, this page gives you the tools and data to make informed decisions.
Key Data Points
Data Point
Description
Token Name and Symbol
Name and ticker symbol of the token.
Token Address
Smart contract address on the blockchain.
Link to CoinMarketCap
Direct link for additional token information.
Current Price
Latest trading price on AuriSwap.
Price Percentage Change
Change in price over specified periods.
Trade Button
Button to initiate trading.
Total Volume Locked (TVL)
Total value of assets locked in liquidity pools.
Market Cap
Total market value of the token.
Fully Diluted Valuation (FDV)
Potential market cap if all tokens are circulating.
1 Day Volume
Total volume traded in the last 24 hours.
Time of Transaction
Timestamp of when the transaction occurred.
Transaction Type (Buy/Sell)
Indicates whether the transaction was a buy or sell.
Volume Chart
Bar graph of trading volume over time.
Liquidity Chart
Line graph of liquidity levels over time.
Price Chart (Line and Candle Stick)
Visual representation of price movements.
Transaction Listing:
The transaction listing section displays real-time data for each swap involving the token. This information includes:
Time of Transaction: The exact time when the transaction occurred.
Transaction Type (Buy/Sell): Indicates whether the transaction was a buy or sell.
Token A Swapped Amount: The amount of the first token involved in the swap.
Token B Name and Swapped Amount: The name and amount of the second token received during the swap.
USD Value of Transaction: The total value of the transaction in USD.
Wallet Address of Swap Performer: The wallet address that initiated the transaction, giving transparency to on-chain activity.
Graphs and Charts:
The Token Analytics and Details page also provides visual data representation to help users analyze trends over time. This includes:

Shows a simple line chart for beginners to follow token’s price changes over selected time periods as below. This helps traders to analyze the performance of tokens over specific periods of time
1 Day
1 Week
1 Month
1 Year
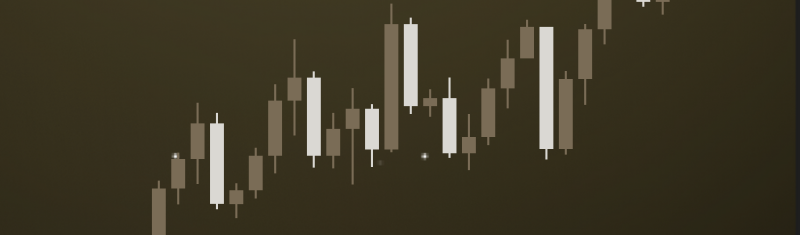
Candlestick charts provide a detailed view of price movements within a specific time frame, showing the open, close, high, and low prices. This chart is particularly useful for advanced traders who want to analyze market trends and price action in greater depth, helping them make more informed trading decisions.
Open: Price at the start of the selected time interval.
Close: Price at the end of the selected time interval.
High: The highest price during the selected time interval.
Low: The lowest price during the selected time interval.
Candle Width: Represents the timeframe (e.g., 1 day) being analyzed.
Candle Length: Represents the percentage price change within the interval.
Candle Wicks: Represent the highest and lowest prices within the candle’s timeframe.
Positive price changes are represented by green candles, while negative changes are shown in red.

This simple bar graph shows the token’s trading volume over selected time periods
1 Day
1 Week
1 Year
This helps users understand how actively the token is being traded.
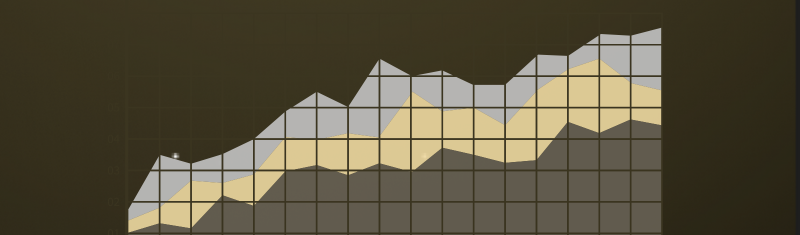
Displays the token’s liquidity levels over time, giving insights into its market stability and potential for slippage.
Shows the token’s trading volume over selected time periods
1 Day
1 Week
1 Year
Exploring Timeframes:
Users can explore token performance over various time periods:
1 Day, 1 Week, 1 Month, and 1 Year: The charts and analytics allow users to filter data across these timeframes, helping them identify trends and spot long- and short-term opportunities.
Why Token Analytics and Details Matter:
This section is a key resource for traders, liquidity providers, and investors looking to gain deeper insights into the token’s behavior on AuriSwap. With detailed metrics, visual charts, and real-time transaction data, users can make data-driven decisions, whether they are trading or providing liquidity.
Interpreting the Data
Each of these data points plays a critical role in helping users assess the market performance and transactional activity of a token. For instance, the Transaction Type (Buy/Sell) can offer insights into current market sentiment—an increase in buy transactions may signal growing demand for the token, while a rise in sell transactions could indicate profit-taking or market corrections. A token with high USD Value of Transactions suggests significant liquidity movement and potentially heightened market interest, especially when larger trades are frequent.
The various Graphs and Charts provide a comprehensive view of the token's historical and recent performance. For example, a rising Price Line Graph or Candlestick Chart may suggest upward momentum, while a high Volume Bar Graph might indicate strong market activity and liquidity. On the other hand, a declining TVL Line Graph could hint at decreasing liquidity, suggesting caution for traders and liquidity providers as the token may face higher volatility and slippage in trades.
By interacting with this section, users can better understand the token's transactional history and liquidity trends, ultimately helping them make informed decisions about trading, holding, or providing liquidity.
Last updated